No Tolls on The Bridge!
A $2.50 toll each way, 5 days/week, 50 weeks/year adds up to a yearly toll of $1250/year in AFTER TAX MONEY ($1600 in 2017 dollars). People who work in Oregon will probably have to earn at least $1700/year to pay this toll. (2006 dollars, $2100 in 2017 dollars)
They are considering triple the above tolls to force you to use transit:
It gets worse!
Quotes From The Columbian, Friday, June 5, 2009 (local copy):
a triple toll, $7.80 each way during rush hour in 2017
. . .
But if you want to raise the big money, you double that base toll and place it on
both the I-
That would raise a projected $6.06 billion over 30 years, more than enough to pay
the entire cost of building a new I-
Triple tolls of $7.80 each way ($15.60 round trip) are $3900/year!
BEFORE TAX!
Can you get a $5000-
Can you afford to waste an extra hour or two each day shifting to transit?
From the Draft Environmental Statement, page S-
Bridge Toll
Tolling will likely be necessary to generate the local revenue needed to help pay for the CRC project. Tolling was used to fund the original construction of the Interstate Bridge in 1917, and again in 1958 to pay for construction of the second span.
Several tolling scenarios are being evaluated (Exhibit 21):
• No toll (part of the No-
• Standard variable rate on the I-
• Higher variable rate on the I-
• Standard variable rate on both the I-
potential traffic diversions resulting from tolling the I-
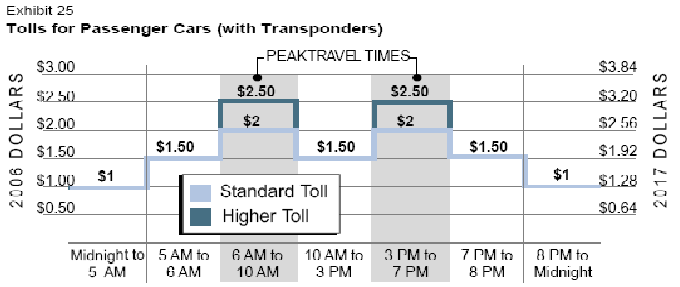
Different toll rates would be charged based on the type of vehicle and the time of
day, with higher tolls charged during peak commute periods. Tolls would be collected
through an electronic toll collection system so that traffic would not have to stop
or slow down when crossing the bridge. Instead, motorists could equip their cars
with transponders that would automatically bill the vehicle owner each time they
crossed the bridge. Cars without transponders would be tolled by a license-
These different tolling scenarios are being evaluated for several purposes. Evaluating
different rates on the I-
Tolls as high as $3900/year are being proposed
you’d have to get a $5000-
Tolls are Planned to be $2000 per Year for Commuters
Chapter 4 of The Interstate 5 Columbia River Crossing Project Final Environmental
Impact Statement contains financial data including tolling scenarios. Exhibit 4.33,
Toll Rate Schedule Scenarios -
Given the baseline financial assumptions used in this FEIS, finance plan scenarios based on either the Base (Schedule 1) or Schedule 2 toll rates do not appear to be viable. The finance plan scenario shown assumes Toll Rate Schedule 3 and employs its entire borrowing capacity. It employs 3 years of precompletion tolling on a cash basis and a small amount of residual toll revenues. (Emphasis added)
Therefore it is appropriate to use the tolling data from Schedule 3 which shows a
$3.00 toll from 6-
Toll rates are shown in 2006 dollars. Toll rates are assumed to escalate at 2.5% per year.
If the bridge opens in 2019, at 2.5% per year increase, that $3 toll becomes $4.14 each way or $8.28 per day for commuters.
$8.28 per day is $2000 per year.
With yearly increases that becomes $3000 per year just 15 years after opening.
Calculations:
3 x 1.025^13 = $4.14
4.14 x 2 = $8.27
8.27 x 250 = $2068
2068 x 1.025^15 = $2995
Note:
1.025^13 = 1.378511
1.025^15 = 1.448298
But Tolls might reach $4000 per Year for Commuters!
The Columbia River Crossing Project ANNUAL SECTION 5309 NEW STARTS REPORT CAPITAL AND OPERATING FINANCE PLAN September 2011 created by the CRC for the FTA in compliance with annual New Starts reporting requirements contains this statement on pdf page 43:
2.5.2.4 Adapt Tolling to Different Circumstances if required to Rebalance the Funding Plan
Toll rates can be adjusted within reasonable amounts if additional funding capacity is required. Tolling analyses found that gross toll revenues can be increased by raising toll rates up to almost $6.00 (2006$) each way, after which the diversion impacts of higher rates exceeds the added revenues the higher rates produce. Toll rates that high are not being proposed. However, the analysis demonstrates that an increased toll rate schedule can produce additional funding capacity, if that was required.
Again, adjusting that $6 toll from 2006 dollars to day of opening we get $8.28 each way, or $16.56/round trip, which is $4140 per year for commuters.
With yearly increases that becomes $6000 per year just 15 years after opening.
Calculations:
$6 x 1.025^13 = $8.27
$8.27 x 2 = $16.54
$16.54 x 250 = $4136
$4136 x 1.025^15 = $5989
Previous version of this page was based on the Draft EIS and is preserved below:
| CC_Email-1 |